|
Research in the Holzwarth lab has recently centered on improving DIC microscopy with polarization modulation [Holzwarth, G, Hill DB, and McLaughlin EB, Applied Optics 39, 6268-6294 (2000)]. By switching the polarization of the incident light in alternate video frames with a computer-controllable, liquid crystal, variable retarder (modulator), the contrast signal of unstained biological specimens is increased by a factor of two, relative to "standard" video-enhanced DIC. The modulator switches image highlights into shadows and vice versa.. By subtracting alternate frames, a difference DIC image is created in which contrast is doubled while image defects and noise tend to cancel. The method can take full advantage of the extended dynamic range and more precise digitization (10 or 12 bits) of modern CCD cameras as well as the increased speed of modern frame processors. The need for a background image(Allen & Allen, 1983; Salmon, 1995), which requires some operator skill for best implementation, is eliminated.
A DIC microscope with modulator installed is shown in Figure 1 below. A variable retarder with 18 mm aperture and 8 mm thickness is installed on a swing-out holder between the polarizer and the condenser.The electronic controller for the waveplate is synchronized with the camera.
|
Figure 1. DIC microscope with modulator between the polarizer and the first Nomarski-Wollaston prism.(modified from Lang,1968).
How polarization-modulation switches contrast
The intensity of the light transmitted by the analyzer in a normal DIC microscope is given by
 (Eq.1) (Eq.1) |
 (Eq.2).
The polarizations of the light in each beam are shown in Figure 2 for +G= + 90 and -G= - 90° .
_________________________________________________________
- 90° +90°
Figure 2. Ray Paths and Polarizations in PM-DIC for G= + and - 90°. (Diagram adapted from Spencer, 1982)
_________________________________________________________
For +G, an embedded phase object within the sample will normally have a highlight on its upper left edge and a shadow at its lower right edge, as explained in Fig. 3, right-hand inset. This gives the apparent 3D effect characteristic of DIC images.
Figure 3. Generation of image contrast. The main curve shows the relative intensity as a function of the total phase shift D = G + d. The inset on the right corresponds to normal DIC with G=90°. The phase object shown has d > 0 on its left edge and d < 0 on its right edge, which gives a highlight on the left side of the image. In a real-time system, images 0, 2, 4, etc would have this shading.
The inset on the left side of Fig. 3 describes what happens if G switches to -90°. With this change, the intensity on the left edge of the image is less than the intensity at the right edge. This leads to inverted shading and applies to images 1, 3, 5, 7, etc.
__________________________________________________________________
The pm-dic image is obtained from the images for +G and -G by subtracting Eq 2 from Eq. 1 to yield,
Selection of the optimum value of G is discussed in the Applied Optics paper. It is shown there both experimentally and analytically that the optimum signal-to-noise ratio occurs when G = d and Io is a maximum without overfilling the CCD wells of the camera.
Experimental Demonstration
Images of the diatom Frustulia rhomboides collected with polarization modulation are shown in Fig 4.
|
|
|
|
| G = +90° | G = -90° | Difference Image |
Figure 4. Images of a small region of the diatom Frustulia
rhomboides obtained by polarization-modulated DIC microscopy.
______________________________________________
Real-time(30 frames/s) PM-DIC can be implemented for many different types of CCD cameras. In our first implementation using a DisplayTech ferro-electric liquid-crystal modulator(J. Microscopy 188,249-254(1997)), we used RS170 video-rate CCD cameras from Hamamatsu(C-6489/Sony XC7500) and Paultek. This modulator can only function between G = +90° and G = -90°. The real-time processing can be done by a Hamamatsu Argus 20 or Dage DSP 2000 processors; Hamamatsu markets this system in a pm-dic package for various microscopes.
In our improved system [Applied Optics 39, 6288-6294(2000)], a CRI variable retarder modulates G at angles as small as ± 5° and as large as ± 120°. Smaller values of G give images with substantially reduced noise. Additional improvements in spatial resolution and SNR are obtained by using 10- and 12-bit digital cameras such as Kodak ES1.0 and Hamamatsu Orca. For digital CCD cameras, we have used a Matrox Genesis image-processing board in a PC.
Once installed, PM-DIC is simpler to use than standard video-based background subtraction techniques, because background subtraction is done automatically. This frees the microscopist to concentrate on the specimen, a substantial advantage. Also, the small intensity differences which make up the image are doubled in PM-DIC, revealing more subtle features of the specimen. Thus, the finer gray-scale of 10- and 12-bit cameras can be used to good advantage.
Shown below are several images demonstrating what pm-dic can do:
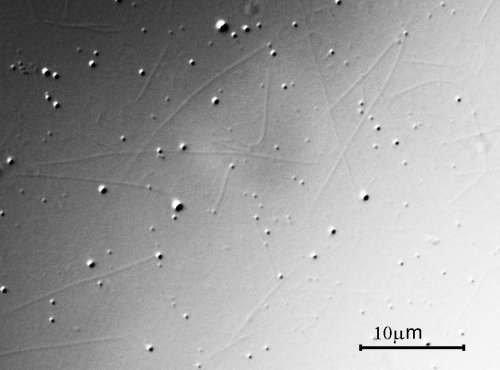
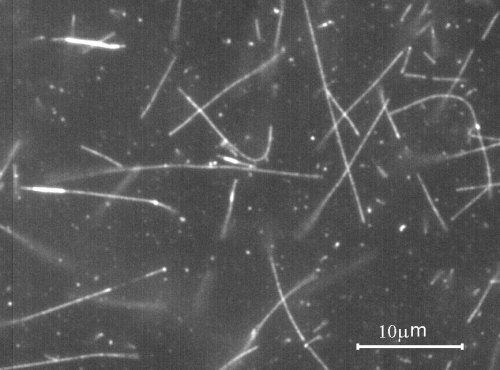
A. Microtubules were prepared from tubulin provided by Cytoskeleton Inc. The pm-dic image and the fluorescence image shown below were acquired with a Zeiss Axioplan microscope with 63X /NA1.4 objective, NA 1.4 condenser, 2X optovar, Hamamatsu Orca 12-bit cooled CCD camera.
  |
|
pm-dic image of microtubules fluorescence
image of same microtubules
|
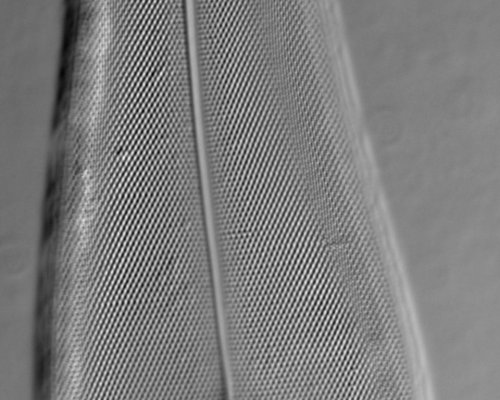
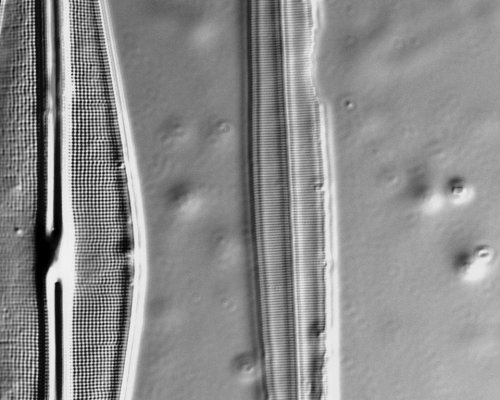
To demonstrate the spatial resolution of pm-dic, the two images below show diatoms 6, 7, and 8 on the Carolina Biological diatom test plate(25D), again using the Hamamatsu Orca camera with 6.5 x 6.5 micron pixels:
B. Pleurosigma angulatum (diatom 6) with spacing between spots = 530 nm:
 |
C. Frustulia rhomboides (diatom 7, spacing 290 nm) and Amphipleura pellucida (diatom 8, spacing 270 nm) under the same conditions:
 |
Remember that the images you see have been compressed.
Click here to see a short movie of epidermal keratocytes(
2.5 MB).
Friday, 27-Jan-2006 15:18:19 EST