(336)
758-5035
The two decades or so starting with the late 70s may be
characterized arguably as the era of renaissance of quality management. During this time, product and service quality
has occupied the minds of business practitioners and researchers probably more
than any other topic. Many
organizations— both business and otherwise, have frequently attempted quality
improvement programs and achieved various degrees of success. Concurrently, a
voluminous literature— not all free from controversy, on topics ranging from
mundane quality control charts to the role of quality in a company's
competitive strategy has accumulated. Within a relatively short period of time
the nature of quality management has undergone a transformation. Whereas only a
few decades ago, product and service quality was something that belonged to the
factory floor, hourly machine operators, and quality control technicians,
recently it has been elevated to corporate boardrooms, strategic plans and
company mission statements. According to Garvin [1987], until 1980s even the
most noted quality experts such as Juran and Feigenbaum,
wrote on quality management from a mostly technical perspective, rarely
stressing its strategic impact and importance.
Literature on manufacturing strategy, since roughly 1970s
starting with Skinner’s [1969] seminal work, recognizes quality, along with
price, delivery performance and flexibility as capabilities on which a company
can build its competitive strategy (for instance, see Stonebreaker and Leong [1994]).
Whether these capabilities are or are not subject to trade-offs has
been, and is being hotly debated. Two
prevailing views are: 1) that there are inherent trade-offs among these
capabilities as Skinner [1996] reiterates and clarifies his earlier work [1969]
that a plant designed to excel in one of these capabilities may not be able to
excel in the others. And 2) that it is plausible for an operation to improve on
all the capabilities simultaneously as claimed by some recent studies, (Ferdows and DeMeyer’s [1990] ”sand-cone” theory, Hayes and Pisano[1996]
and others). Although this debate on
the trade-off issue in manufacturing strategy is relevant to the main theme of
this paper, divulging into an extensive review of manufacturing strategy
literature is beyond its scope. For an
empirical treatment of the trade-off debate see, for
instance, Safizadeh et al
[2000].
This paper focuses, within the broader trade-off issue, on a
narrower trade-off between cost and quality.
The existence of possible conflict between cost and quality has also
been fervidly debated for a long time now. Unfortunately, however, the question
of “is quality free?” has not yet been fully settled. The dilemma stems from Juran’s [1951]
well-known model of “cost of quality,” which seems to imply the existence of a
minimum-cost quality level, which may occur at short of perfect quality. This, in turn, has been an uncomfortable
conclusion to accept for many authors, led by
This paper attempts to articulate a new interpretation of the
existing cost of quality models to bring a new perspective to the cost vs. quality dilemma.
The paper first explores the cost-quality connection, namely the
economic role of a firm’s quality policy within the framework of its
competitive strategy. It then offers a
new interpretation of the traditional cost of quality models based on two
observations. One observation deals with
the distinction between two definitions of conformance: the conformance
inherent to a process as opposed to the conformance that the customer
sees. The other is the behavior of
various cost components in the short as opposed to long-run. This behavior is
partly due to a distinction drawn between two types of prevention interference:
day-to-day prevention activities whose results and costs are short-term and
prevention investments whose results and costs span a longer period. It argues that depending on which definition
of conformance and what time frame is used, the traditional cost models may
imply different things. It shows that
although the long-run behavior of the relevant costs tends to push the point of
optimal quality towards “perfection,” there is still no conceptual a-priori
argument to rule out possible cost vs. quality trade-off. Even in the long-run, whether perfect quality
will coincide with minimum cost point remains an empirical question to be
answered on a situation by situation basis.
The rest of the paper is organized as follows. Section 2 presents
a brief but critical review of the literature dealing with the issue of cost of
quality; and undertakes a more in-depth discussion of Juran’s
cost model and the literature championing the coincidence of minimum cost and
perfect conformance quality. Section 3
presents an original model of quality policy.
This model not only dissects the term quality into components relevant
for the purpose of trade-off issues but also situates quality (with its long
and short-run implications) in the broader context of a firm’s competitive
strategy. Section 4 presents a revised
interpretation of the cost of quality model, based on two definitions of
conformance and long and short-run cost behaviors. Section 5 concludes the paper.
2. Relevant literature
Ever since Juran [1951] tried to
cast quality as a management realm in terms of avoidable and unavoidable costs,
the concept of cost of quality has received a great deal of attention. Juran recognized
three categories of relevant costs that vary with non-conformance rates. Failure costs include internal failure costs
such as rework, scrap and external failure costs such as recalls, warranty,
litigation, and indirect (opportunity) costs such as loss of customer goodwill. Secondly, prevention costs are incurred for
activities and programs that aim at performing the required tasks
correctly. They include, among other
activities, product and process redesign, employee training, preventive
maintenance, process improvement by uncovering and eliminating root causes of
non-conformance. Thirdly, appraisal
costs include the costs of sampling, inspection, screening/rectification
(complete inspection and correction of non-conformances since the last ample
either by replacement or rework), data collection, processing and analysis.
Juran termed the failure (non-conformance) costs as avoidable to lead managers
to think about quality of conformance in more motivating cost terms rather than
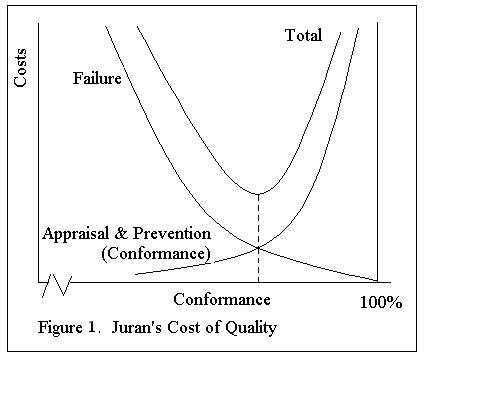
in abstract conformance indices. He
proposed his well-known model for minimizing total cost of quality as in Figure
1. In this model the sum of appraisal
and prevention costs, termed as unavoidable, is represented as a non-decreasing
convex function of conformance rate.
This functional form implies that achieving higher and higher rates of
conformance requires increasingly more stringent quality appraisal and/or more
extensive prevention, causing these costs to climb at an increasing rate. Likewise, the sum of internal and external
failure costs, termed avoidable, is modeled as a non-increasing convex function
of conformance rate implying that these costs climb at an increasing rate as
conformance level worsens.
If, indeed, the cost relationships are as modeled, and the
overriding company objective is to maximize profits, then Juran's minimum cost
conformance rate is on solid economic theory grounds. This is the point where the marginal cost of
conformance (prevention and appraisal) equals that of non-conformance
(failure). Unfortunately, however, this
minimum cost point has a very unappealing feature. It may, and most likely will, occur at a
point where conformance is less than perfect.
This result is quite contrary to many of the maxims, principles, and advice
from the majority of quality gurus who defend 'zero defects' as the essence of
any sound quality policy. In the current
business atmosphere where quality is widely considered to be the core of any
successful business/competitive strategy, a less-than-perfect conformance rate,
albeit cost-wise optimum, is indeed quite difficult to
accept.
A dilemma has then arisen between Juran's “traditional
economic solution” and the appealing concept of “zero defects” as the basis of a
firm’s quality strategy. To reconcile
this dilemma, many authors led by
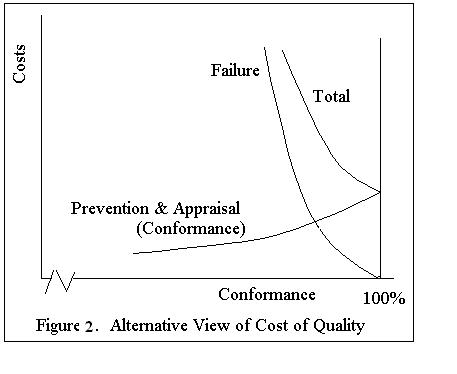
Some other authors, in addition to the indirect costs, have argued for various and specific reasons for the relatively flat shape for the prevention costs. See for instance, Diallo et. al. [1995], and Carr and Tyson [1992]. According to this view, if the prevention cost function is not heavily convex but sufficiently flat, minimum cost will be attained at full conformance level as in figure 2. In the same spirit, Crosby himself claims that "prevention costs do not increase marginally, that no problems are diabolically difficult, and that systematic approaches to prevention of defects do not increase in cost." This line of reasoning seems to resolve the dilemma in a rather neat way.
The crux of this argument is based on an untested presumption
however. After all, the shape of the
prevention cost, or all other costs for that matter, is an empirical question
to be considered separately for each individual situation. There is absolutely no a priori basis on
which one can justifiably make such a blanket assumption. In fact, if any argument can be made a
priori, there is perhaps some theoretical defense for an increasing, convex
prevention cost function as envisioned by Juran. At any point in time, a process (e.g., a
piece of equipment) may be associated with a set of problems (root causes) that
prevents it from performing perfectly.
Prevention activities can be regarded as efforts to find and correct
these causes. If it is assumed that all
the root causes are not equally difficult (or easy) to discover and correct,
it, then, follows that the 'easier' root causes will be discovered and
ameliorated first, making the next step of improvement harder to achieve. This implies a convex cost behavior. The plausibility of this assumption may be
demonstrated by the Ishikawa or cause-and-effect diagrams (see for instance
Omachonu and Ross [1994]), which are widely used to analyze process
problems. In these diagrams, some
process problems are close to the backbone (primary), while other problems may
be secondary, tertiary or even higher order.
The root causes at the end of longer causality chains are more difficult
to discover and correct.
Narasiman, Gosh and Mendez [1994] model the impact of superior quality and price
on the market share of a firm. This model offers indirect support for the
hypothesis that cost and quality are not necessarily conflicting objectives.
Another cluster of studies has tried to reconcile the trade-off dilemma by the behavior of Juran’s original cost relationships over time. Fine [1986] and in way of extension later, Marcellus and Dada [1991] have considered the effects of quality-based learning on the prevention costs using rigorous analytic models. Their theory maintains that firms choosing to produce at higher conformance rates will experience faster learning thus faster cost reduction in their production activities. This way, they see cost and quality as reinforcing rather than opposing objectives. Prasad and Tyson [1995] synthesize the learning effects influencing the prevention costs, with the forces that competitors exert by improving their quality, on the failure costs of the company. They show that though both of these forces will move the optimal quality level towards full conformance. Interestingly, however, as quality approaches towards full conformance, the optimum cost could decrease as well as increase depending on the relative strength of these forces. These works are closely related to one of the themes of the present paper which explores the same type of temporal phenomena at a more conceptual and a broader context. This paper extends the scope of the analysis to distinguish between long and short-run implications of the dynamic behavior of all quality-related costs as a result of deliberate and economically justifiable management policy and not just passive result of learning phenomena.
3. Quality Policy and Competitive Strategy
Following the early lead of Skinner [1969] several important
works have appeared in mid 80s (e.g., Hayes and Wheelwright [1984] and Buffa [1984]) which explored the role of manufacturing in a
cogent competitive strategy. The path
these pioneers have opened has been traveled by a growing number of authors,
some of which were mentioned in section 1.
3.1 Structural, and Quasi-Structural
Strategic Decisions. Hayes and Wheelwright [1984] characterize manufacturing as a “formidable
competitive weapon” and define manufacturing strategy as a pattern of decisions
over time by which the competitive factors of high quality, low price, delivery
performance and flexibility are pursued.
Strategic decisions are generally associated with a long planning horizon,
both in terms of carrying out such actions as well as realizing their outcomes.
Buffa [1984], on the other hand, categorized the major strategic decisions
into a relatively small number of more specific realms: positioning the
production system, capacity/location decisions, product and process
technologies, vertical integration and suppliers, and strategic implications of
operational decisions. All of Buffa’s
categories, except the last one, affect the very nature of the system by which
a company creates value. As such, these
decision categories may be termed as structural-strategic decisions. Strictly speaking, the last category,
day-to-day operational decisions, when each occurrence taken separately, are
not strategic: they do not have the properties that the structural strategic
decisions have, such as a long-term horizon, pervasiveness, impact, etc.(Hayes and Wheelwright [1984]). However, when viewed as a pattern of
decisions over an extended period of time, they may have profound effects on
the competitive and strategic outcomes of the company. For this reason, we will refer to policies
that guide repetitive operational (short run) decisions over an extended period
of time as quasi-strategic.
For example, adding a new plant or expanding an existing one are clearly structural strategic decisions. While a decision at a specific date regarding
the inventory replenishment quantity of a certain component is not strategic,
an inventory replenishment policy (pattern of operational decisions), based on
a JIT philosophy has strategic importance and it is thus quasi-strategic.
3.2 Primacy of the Economic Objectives. Although recent theories in
strategic management consider a broader set of objectives than the mere profit
motive which drives corporate strategy, (see for instance Kaplan [1990]), the
priority of economic objectives is seldom challenged. Therefore we start with the premise that
most, if not all, companies are in business to make money in the short as well
as in the long-run. Most other stated or
implicit goals can be traced to this objective.
A corollary to this premise is that the role of a quality policy, (or of
any managerial endeavor for that matter,) in the competitive strategy of a
company can only be assessed in term of its impact on the economic
outcomes. To be an effective and viable
strategic weapon, the quality policy of a company cannot stand on its own but
must be built on a solid economic base.
The policy must be more than a highly simplistic or evangelical
recommendation: "achieve the best score on each of the quality
dimensions," however defined. A
solid quality policy cannot solely rest on lofty moral or ethical maxims such
as "do what is right;" or the righteous deed "to provide the
best customer service;" or an impossible dogma "perfect quality in
the short and in the long-run at all costs." It must be based on a careful economic
evaluation of a myriad of alternative actions and trade-offs in the long as
well as in the short-run.
3.3 Quality Policy. A quality policy that a company
pursues as part of its competitive strategy may be defined as all
decisions and choices that directly or indirectly affect a company's ability to
offer to a target market quality product and services to enhance its economic
objectives. Thus a comprehensive quality
policy has both long-run (structural-strategic) and short-run (quasi-strategic)
components. To be effective, both
components, each affecting the economic objectives in unique ways, must clearly
be aligned with the company strategy.
Both the long-run decisions such as the determination of product
performance characteristics in the design process, and the short- run
implementation issues, such as determination of operational parameters of a statistical
quality control program, must be justified in terms of their economic
consequences.
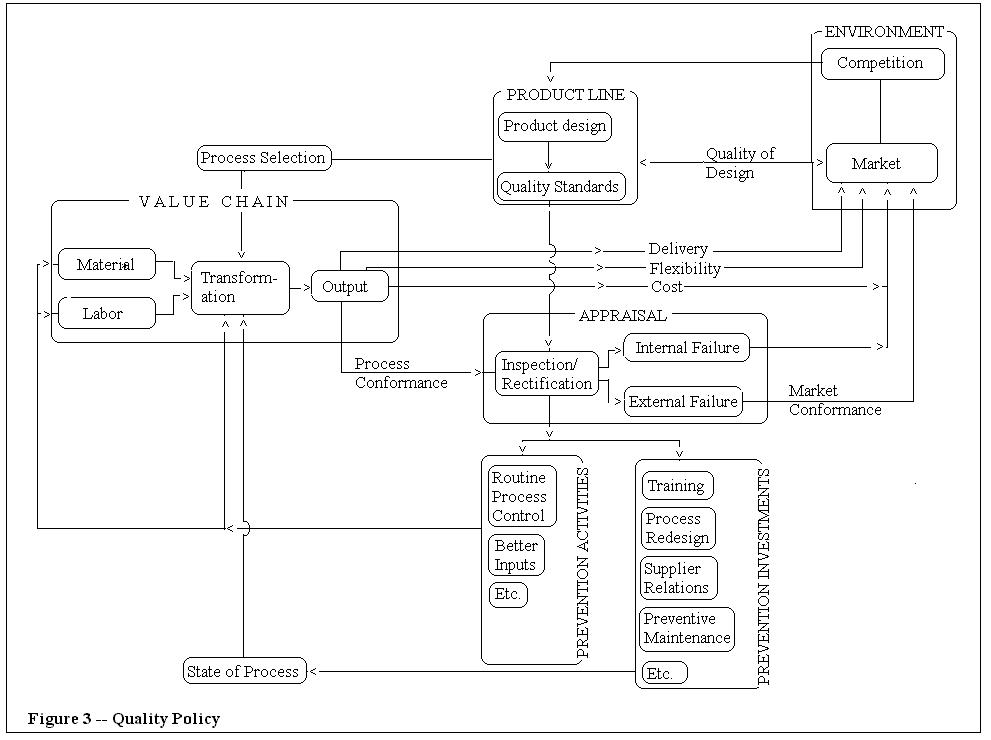
Figure 3 depicts various
components of a quality policy and their relationship to Porter’s [1985]
well-known “value chain.” The components
of a quality policy are on the right and can be broken into the areas of
quality of design and quality of conformance (Juran [1969]).
3.4 Quality of Design deals with the
translation of perceived market needs into a set of design specifications and
quality targets along various performance dimensions. Product and service design is a critical
strategic component whose impact on the company success transcends its quality
implications. It aims to deploy its
competencies to best advantage by defining its markets and its
competition. The primacy of the economic
objectives implies that the economically justifiable design must achieve a
level on each performance dimension so as to equate the marginal worth of this
dimension as perceived by the targeted market segment to its marginal cost. Juran [1969] states this principle succinctly
by saying: "We should put forth whatever effort is required to meet the
needs of fitness for use. We should
avoid any effort which does not contribute to fitness for use." There is general agreement for the existence
of a trade-off between cost and quality of design. A product that achieves a
higher performance on any dimension will cost more to produce.
3.5 Quality of Conformance
The long-standing debate on the possible trade off between quality and cost
objectives pertains to the second part of quality policy-- quality of
conformance. This component includes all
decisions affecting the frequency of adherence to the established design
specifications and quality standards.
This is the definition of quality implicit in Juran’s [1951] cost of
quality model. Quality of conformance,
as a management endeavor, in turn, can be broken into the areas of appraisal
and prevention. The short and long run
cost behaviors of appraisal and prevention activities are quite different. They affect economic objectives in distinct
temporal ways.
Most appraisal activities deal
with day-to-day execution of a quality control system, which most often
consists of statistical process control, acceptance sampling and other related
techniques to initiate a prevention intervention. Appraisal may also include a level of
rectification. As will be seen in the
next section, the rectification as part of the appraisal process has a
paramount impact on the interpretation of the cost of quality models.
Quality control activities
using these and similar techniques affect, on a daily basis, such costs as
inspection, internal and external failure costs and such market objectives as
conformance level as seen by the customer.
Strictly speaking, these decisions—frequency of inspection, decision
rules as to when and what corrective action to take, etc. are short-term and
non-strategic in nature, yet they are quasi-strategic in the sense that they
have, over an extended period, strategic implications.
Prevention can be analyzed into
two categories: On the one hand there are prevention
activities which, may be considered as discrete investments whose outcomes are
not necessarily confined only to the periods in which activities are undertaken
but are realized over an extended period of time. On the other hand, there are those day-to-day
prevention activities whose costs and results are primarily confined to the
current period and do not carry over to the future periods.
The model in figure 3 also
makes a distinction between two concepts of conformance. These are respectively, the process
conformance, which is the level of conformance inherent to the process when it
operates, as it normally should and the market conformance, which is the
conformance that the customer sees after any appraisal/rectification activity.
4. Alternative Interpretations of the Cost of Quality Models
Both figure 1 (Juran solution) and figure 2 (alternative proposed by the flat prevention costs) are vague as to how the graphed quantities are measured. Neither model specifies clearly where the conformance is measured— before or after appraisal/rectification takes place. In both models ‘cost of conformance’ is plotted as a single curve representing the sum of prevention and appraisal costs; likewise, ‘cost of non-conformance’ is in aggregate terms and does not show how failure costs break in to internal and external components. Furthermore, the time dimensions in which various cost components are measured are largely left unspecified. The alternative view of cost of quality models is based on the distinction between the process and market conformance levels and between short and long run cost behavior.
4.1 Pre-and post-appraisal conformance--The fear to accept the less than full but minimum cost solution of figure
1, partly stems from the failure to distinguish between two definitions of
conformance. While the process conformance is inherent to the process and measures
the level of conformance a process is capable of, prior to any appraisal/rectifying
activity, the market conformance measures
conformance after any appraisal/rectifying activity takes place. In the context of the role of quality in
competitive strategy, any reference to quality of conformance as a competitive
priority must be made with market rather than process conformance in mind, as
this is the level of conformance that the customer sees. Clearly, any rectification
of the non-conforming units, causes the process and market conformances to
diverge unless they are both perfect.
While this distinction is quite important in product quality is it less
so in service quality, since rectification in services is inherently more
difficult. A poor service already delivered to a customer may not be easily
rectified. By aggregating appraisal with
prevention, and internal with external failure costs together, traditional
models blur this important distinction.
While prevention affects primarily the process conformance,
appraisal/rectification my affect both process and market conformances.
If appraisal is intended exclusively for process control
(detecting an out-of-control condition) and does not include any rectification,
market and process conformance are identical thus the distinction is mute. If, on the other hand,
appraisal includes any rectification at all (as in many acceptance-sampling
schemes), the market conformance (average outgoing quality) will generally
exceed that of process conformance (incoming quality). Neither model is clear as to which
conformance is being optimized. With any rectification, as figure 3
illustrates, a portion of the process non-conformance is converted into another
competitive priority, namely to costs associated with internal failure and
appraisal/inspection/rectification activities.
Ideally, the extent of this conversion from one competitive priority
(conformance) into another (cost) must be governed by its economic
consequences. Thus, when process and
market conformance levels diverge due to any rectification activity, the
relevant (conformance) quality policy becomes to determine not just the
‘optimal’ conformance level but also the ‘optimal’ appraisal/ rectification
parameters—intensity and frequency of sampling, decision rules that trigger
rectification etc. Unfortunately the effect of these two
decisions on the costs are not independent. For instance, increasing
the aggressiveness of appraisal/rectification activity not only increases the
‘cost of conformance,’ but also affects the make up and possibly the sum of the
internal and external failure costs at any given process conformance level.
Thus a two dimensional graph is inadequate to represent the combined impact of
two determinants of a quality policy—prevention on the one hand, and appraisal/
rectification on the other.
Though the two dimensional models such as figures 1 and 2 are
insufficient to represent the prevention and appraisal/rectification components
simultaneously, they may be interpreted as depicting the costs for a given
fixed appraisal/rectification scheme. Accordingly, the optimal conformance
level pictured is the process conformance optimized by varying the intensity of
prevention activity, while the market conformance is somewhere between the
optimal process conformance (corresponding to no rectification) and full conformance
(corresponding to full census and rectification). With this interpretation of figure 1,
less-than-perfect process conformance does not necessarily imply shipping a
certain percentage of poor products to the customers as generally implied by
some proponents of model in figure 2. If
the external failure (including indirect) costs are sufficiently high, through
a stringent inspection/rectifying process, a very high market conformance rate
may be achieved regardless of the level of process conformance. Conceptually,
for any given fixed level of appraisal/rectification activity there is a
different total cost function with a possibly different optimal point. The global optimal policy is that level of
appraisal/rectification, which corresponds to the lowest of these optima.
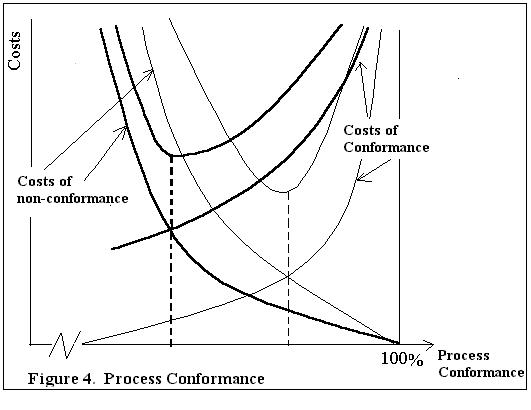
Two such optima, which correspond to two rectification
policies, are simultaneously pictured in figure 4. As the rectification activity intensifies
(drawn in bold curves), conformance costs (prevention plus fixed
appraisal/rectification) increase for any process conformance level and shifts
the curve to the left. Also, assuming
external failure to be more costly than internal failure, a more stringent
rectification program catches a higher proportion of non-conformance, saving
(higher) external, at the expense of (lower) internal failure costs. At any level of process conformance, a more
stringent rectification program thus results in a lower non-conformance cost,
shifting the curve to the left.
Interestingly, as rectification activity intensifies the
optimal process conformance level weakens. Although at a first glance this may
appear to be surprising, a closer look reveals that this is indeed a plausible
phenomenon-- market conformance somewhat protected by a more aggressive
rectification, a lower process conformance becomes less expensive. However, nothing can be said a priori about
the relative magnitude of the optimal costs associated with, nor
the inherent superiority of the two policies.
If the additional burden of intensifying appraisal/rectification is less
than the savings in failure and prevention costs, the bold policy will have a
lower optimal cost and vice versa.
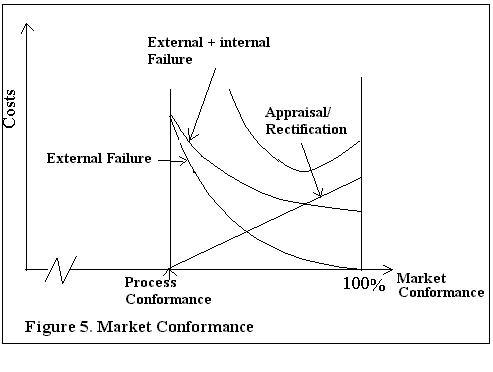
An alternative way to make use of a two dimensional tool to analyze cost behavior is to plot the costs for a given process conformance level implied by fixed prevention activity as in figure 5. When no appraisal/rectification takes place, market and process conformances coincide. As appraisal/rectification intensifies, its cost climbs (drawn linearly here) and market conformance improves and finally reaches 100% when the intensity of appraisal corresponds to full census. Meanwhile, as market conformance increases, the external failure costs decrease directly, whilst the internal failure costs increase, but more slowly. The optimal cost at this level of process conformance is the minimum of the U-shaped total cost pictured plus the exogenous fixed prevention costs.
When the process conformance (presumably achieved through
more intensive prevention) improves to a higher level any desired market
conformance can now be attained using a less stringent appraisal/prevention,
reducing these costs and shifting the cost line to the left (not shown in the
figure). Obviously, better process
conformance will lead to lower failure costs shifting these costs to the left
as well. If the total reduction in these
costs more than offsets the additional prevention cost, the higher process
conformance results in a quality policy with a lower overall cost. Therefore the conceptual global is attained
at that level of process conformance for which the minimum of the U-shaped cost
curve (optimal appraisal/rectification) plus the exogenous prevention cost is
the lowest.
4.2 Time Dimension of the Cost Components--Both models are static in that the time dimension of the costs is
unspecified. Do the functions represent
hourly, daily, annual, or over some other interval average unit costs? Whereas the failures, particularly internal
ones, and appraisal activities result in immediate costs, at least some
prevention programs (prevention investments in Figure 3) have a long-term
nature. Thus their results and costs are not realized immediately. Design
revisions, process alterations, supplier training and selection,
employee-training programs do not result in cost and improved conformance rates
coincidentally. It is therefore somewhat
misleading to compare them to activities resulting in immediate cost and benefits. Such long term prevention interventions may
or may not result in an immediate increase in conformance; and, like other
capital investments, they may have impact beyond the period in which the
activity is undertaken and, costs are incurred. Representing the cost and benefit of such
programs may not be a simple matter of comparison as implied by the models in
figures 1 and 2.
In addition to these long-run prevention programs, management may also have some short-term options, albeit limited, by which it can immediately affect the conformance rate. Employing more refined and higher grade (and more expensive) raw materials, using the ablest and the most experienced operator, slowing down the process, performing routine process adjustments are examples of these short-run prevention measures.
To clearly differentiate between long-run prevention
investments and short-run prevention activities, their results, and associated
costs, we define the concept of the state of a process. This is the level of conformance a process
is inherently capable to achieve in the short-run (now). Conceptually, this level may be associated
with the set of remaining ‘root causes,’ which prevents the process from
performing perfectly. Prevention
investments may be regarded as efforts to discover and eliminate some specific
root causes once and for all. Therefore,
state of the process is a result of prevention investments up to the present
without any extraordinary short-run prevention measures. In the absence of any further preventive measures (short or
long-term), the average process conformance rate will correspond to the state
of the process. The actual conformance
rate a process may achieve, in the short-term, will be around this base rate
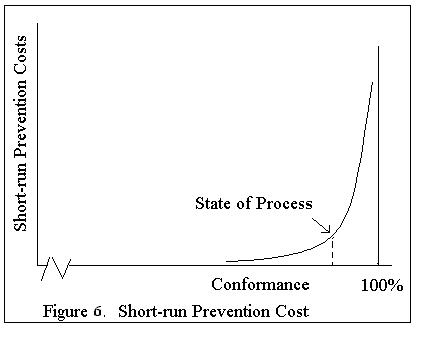
depending on the extent of short-run preventive interventions. The short-run prevention cost can therefore
be modeled as in figure 6, where the bend roughly represents the state of the
process. One can deviate around this
rate by means of various short-run actions in either direction.
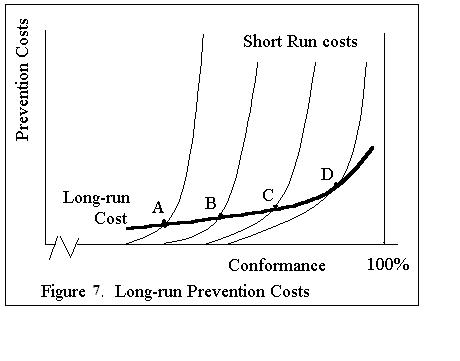
As shown in figure 3, unlike short-run preventive measures,
the long-run prevention investments alter the state of the process. For instance, implementing an
employee-training program, which may take several months, has the effect of
correcting a root cause that keeps the process from performing perfectly. A
long-run preventive program such as an employee-training program will benefit
the process for periods to come without its cost being repeated each period by
removing a root cause. A preventive
program of this sort improves the state of the process and moves the short-run
prevention curve to the right since with an improved state of the process
various short-run conformance rates can now be achieved more easily. Therefore, the long-run prevention cost vs. process conformance rate can be depicted not as a single
curve but by a family of curves as in figure 7.
The policy implication of this interpretation of the cost versus quality relationship is quite clear. At any point in time (in the short-run), economically justifiable level of conformance is where the sum of short-run relevant costs is minimized as per Juran's classical model. However, by investing in long-term preventive programs, the short-run minimum cost point will move to the right towards full conformance. The primacy of economic objectives require that these investments not be made altruistically simply to improve quality but are to be justified on economic criteria such as return on investment-- just like any other investment.
The envelope of the short-run minimization points may now be
termed the long- run prevention cost function.
The long run prevention costs in this model subsumes the concept of 'continuous improvement' as a dynamic process
traced through implementation of economically justifiable pattern of decisions
(investments) rather than a maxim that must be taken on faith.
5. Conclusions
The fundamental question is whether the quality related costs
and quality, however defined, are compatible.
Although the conventional wisdom, mostly based on anecdotal evidence, is
that they are, the answer does not seem to be an unqualified yes. First of all, if by quality one is including
quality of design, there is a clear trade off between quality and cost to
produce. A product aiming at higher
scores on various quality dimensions (say, of Garvin's) will consume more
resources and hence will cost more. On
the other hand, even if the quality is defined more narrowly as conformance to
requirements (
Can one say that the dynamic view of prevention, appraisal
and failure costs has explained away the dilemma of economic rationality and
full process conformance? Unfortunately,
the answer is still no. There is still
no a priori basis to assume that the long- run optimum of figure 7 will occur
at full process conformance. To make
this point, consider a process, such as in chip manufacturing, in which certain
chemical processes are employed that are subject to irreducible uncertainties,
possibly at the quantum physical level.
Due to the fundamental nature of the process, in the foreseeable future,
no amount of prevention/improvement effort may be capable of moving the optimal
point to full process conformance. In a
situation like this, even in the long-run the optimal yield of the process
(process conformance) may be less than full.
However an economically justifiable appraisal/rectification program may
be used to protect market conformance and thus competitive objectives. If and when an entirely new and radically
different process is discovered devoid of the inherent uncertainties, only then
may the full process conformance be economically attained. But in this case the attainment is not a
result of any prevention/improvement activity but a fundamental redesign of the
process outside the context of the prevention/appraisal and failure cost
trade-off analyses. The effect of such a
radical discovery on the long-run conformance may be depicted as a sharp drop
on the long-term conformance cost curve of figure 7.
REFERENCES
Buffa, Elwood
S. Meeting the Competitive Challenge. Richard D. Irwin,
1984.
Carr, Lawrence P and Tyson, Thomas, "Planning
Quality Cost Expenditures," Management Accounting. October,
1992.
Crosby,
Philip B. Quality is
Free.
Diallo,
A., Khan, Z. U., and Vail, C. F., "Cost of Quality in the New Manufacturing,"
Management Accounting, August 1995.
Feigenbaum, A. V., Total Quality Control. 3rd ed. McGraw Hill, N. Y. 1983
Ferdows,
K. and DeMeyer, A. "Lasting Improvements in
Manufacturing Performance" Journal of Operations
Management. Vol. 9.,
No 2., 1990
Fine, Charles. H., “Quality Improvement and Learning on
Productive Systems. Management Science. Vol. 32, No 10, October 1986, pp. 1301-15.
Garvin, David A. "Competing on the Eight
Dimensions of Quality," Harvard Business Review.
Nov./Dec. 1987, pp. 101-109.
Garvin,
David A. Managing Quality. The Free Press,
Garvin, David A. Operations
Strategy: Text and Cases. Prentice Hall,
Hayes, Robert H., and Wheelwright, Steven C.,
Restoring Our Competitive Edge: Competing through
Manufacturing. John Wiley & Sons,
Hayes, Robert H., and Pisano
Gary P. “Manufacturing Strategy: At the Intersection of two Paradigm Shifts” Production and Operation Management. Vol. 5, No 1, Spring, 1996. pp. 25-141
Juran, Joseph M.
Quality Control Handbook.
Marcellus, R. L. and Dada,
M. “Interactive Process Quality Improvement” Management
Science. Vol. 37, No. 11, November 1991. pp. 1365- 1376.
Narasimhan, N., Gosh, S.
and Mendez, D. “ A
dynamic Model of Product Quality and Pricing Decisions on Sales Response.” Decision Sciences. Vol. 24, no. 5
Sept 1993, pp. 893-908.
Omachonu,
Vincent K, and Ross, Joel E., Principles of total
Quality. St Lucie Press,
Porter,
Michael. Competitive Advantage.
Free Press,
Prasad, S. and Tyson, T. “A Dynamic Model of Quality Cost
Expenditures” Mid American Journal of Business,
Vol. 10, No. 2 pp. 13-18.
Safizadeh,
M.H., Ritzman, L.P., and Mallick,
D., “Revisiting Alternative Theoretical Paradigms in Manufacturing Strategy,” Production and Operations Management. Summer, 2000,
pp. 111-127.
Skinner, W. “ Manufacturing—Missing
Link in Corporate Strategy,” Harvard Business Review, No 3, 1969 pp.
136-44
Skinner, W. “ Manufacturing
Strategy on the “S” Curve” Production and Operation
Management. Vol. 5, No 1, Spring. 1996. Pp.
3-14
Stonebreaker, P. W. and Leong, G. K. Operations Strategy:
Focusing Competitive Excellence. Allyn and Bacon,